Before you start
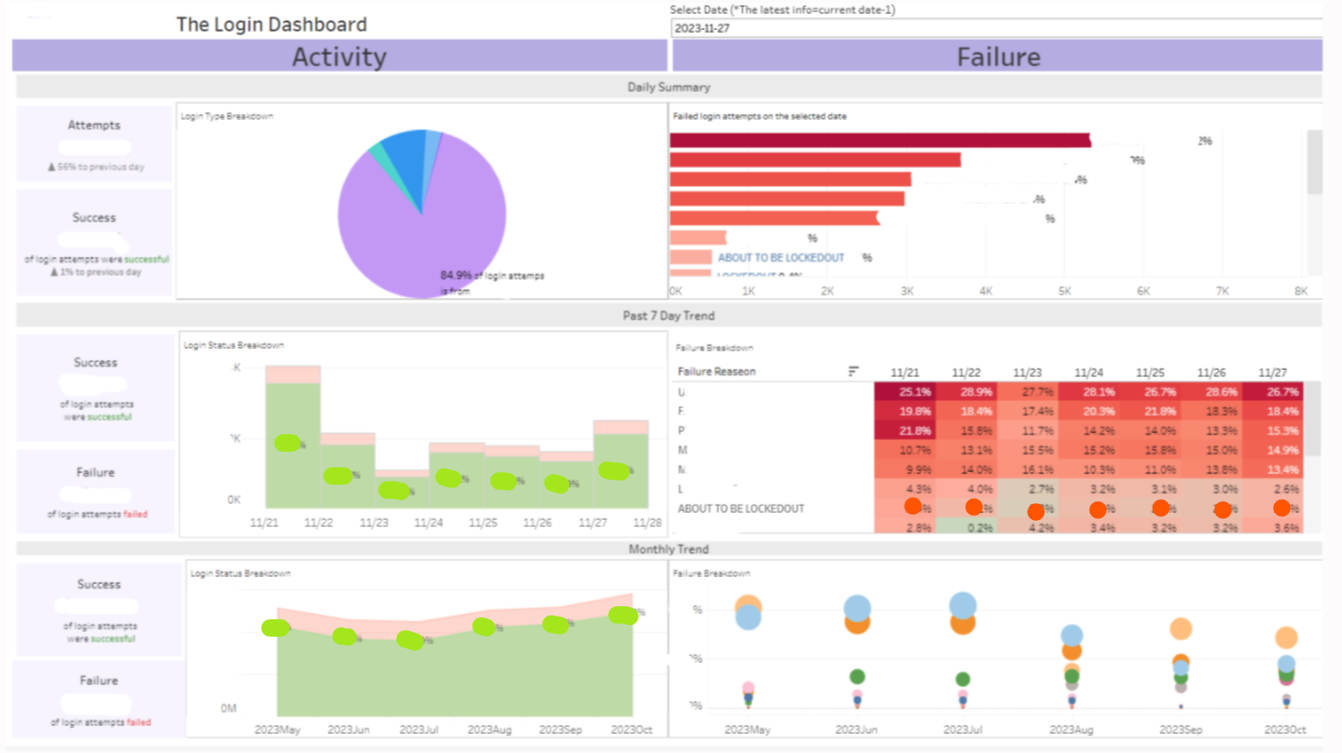
- The dashboard includes a daily summary and trends for the login activity over the past 7 days and the past 6 months.
- The metrics and visualizations displayed on the dashboard change based on the selected date in the upper right corner.
The daily summary
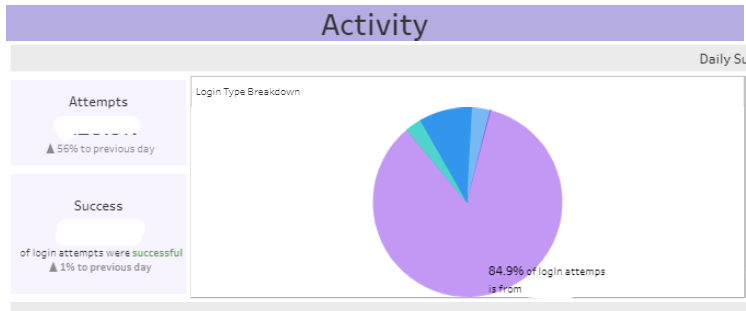
- Login attempts volume and success rate
- summary boxes -The box on the left shows the total volume of login attempts and the success rate on the selected date.
- Success Rate of the date = (Total Successful Attempts of the date / Total Attempts of the date ) * 100
- pie chart - This chart provides an overview and breakdown to identify who performs the login.
- summary boxes -The box on the left shows the total volume of login attempts and the success rate on the selected date.
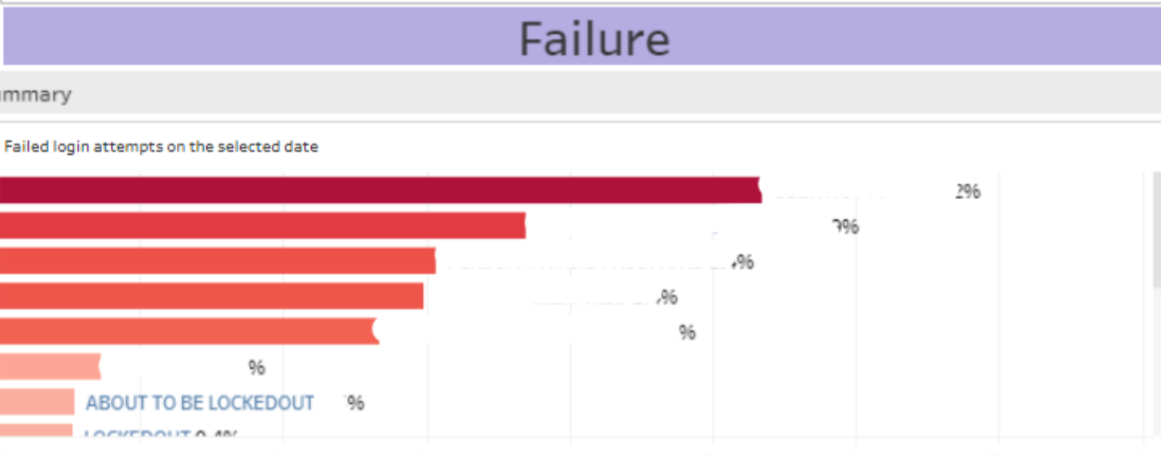
- Login failure type
- bars - each bar represents a type of failure reason and the corresponding amount of failures for that group on the selected date.
The past 7 days trend
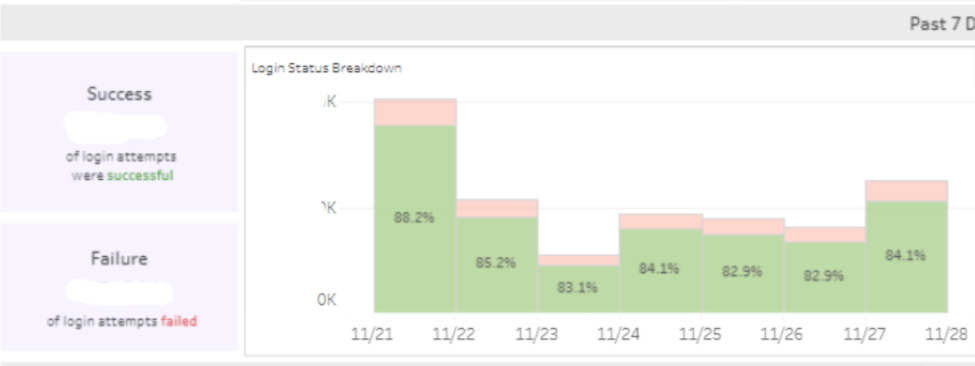
- Login attempts volume and success rate
- summary boxes -The box on the left displays the average login success/failure rate for the past 7 days, based on the selected date.
- Success Rate of past 7 days = (Total Successful Attempts of past 7 days / Total Attempts of past 7 days ) * 100
- Failure Rate of past 7 days = (Total Failure Attempts of past 7 days / Total Attempts of past 7 days ) * 100
- bars - Each bar represents the total login attempts for the date, broken down into two groups—success and failure
- summary boxes -The box on the left displays the average login success/failure rate for the past 7 days, based on the selected date.
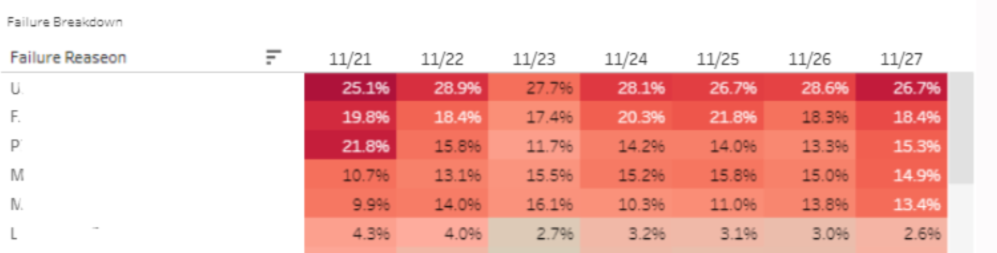
- Login failure type trend
- when reading the table vertically
- the % labeled on cells is calculated as - Failure Attempts caused by a specific reason on a particular date / Total Failure Attempts of a particular date
- when reading the table horizontally
- it reveals the 7-day trend and how a specific failure reason contributes to daily login failure attempts.
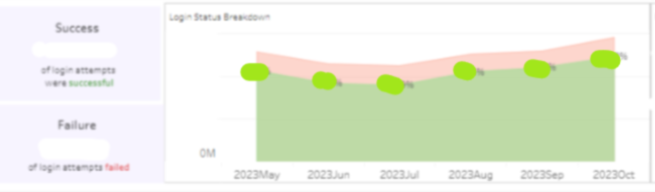
The past 6 months trend
- Login attempts volume and success rate
- summary boxes -The box on the left displays the average login success/failure rate for the past 6 months, based on the selected date.
- Success Rate of past 6 months = (Total Successful Attempts of past 6 months / Total Attempts of past 6 months ) * 100
- Failure Rate of past 6 months = (Total Failure Attempts of past 6 months / Total Attempts of past 6 months ) * 100
- bars - Each bar represents the total login attempts for the month, broken down into two groups—success and failure
- summary boxes -The box on the left displays the average login success/failure rate for the past 6 months, based on the selected date.
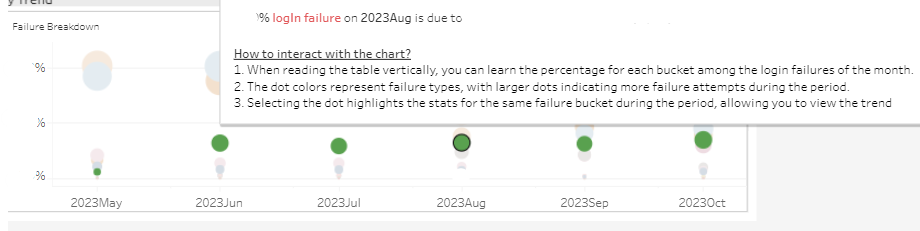
- Login failure type trend
- when reading the table vertically
- the % labeled on the tooltip is calculated as Failure Attempts caused by a specific reason on a particular month / Total Failure Attempts of a particular month
- when reading the table horizontally
- it reveals the 6-month trend and how a specific failure reason contributes to the monthly login failure attempts.
- color - each color represents a specific failure reason
- size - The bigger the bubble, the higher the percentage it represents.