Before you start
- This is a dashboard that monitor the data processing pipeline that ingests data from xxx into the Elastic Search Index
- On the xxx data source, there are 3 pipelines that push data into the A index: prod_Aa, prod_Ab, prod_Ac
- On the ooo data source, there are x pipelines that push data into the B index
- Each execution involves inserting or updating actions to refresh data in the index, with refresh intervals of x, x, or xx minutes for data lookback.
- There are 2 main sections on the dashboard, each having a set of parameters you can use to filter the data.
1st Section
- 2 Parameters
- data import source: xxx/ooo
- time frame: Previous Day, Week-to-date, Month-to-date, Quarter-to-date, Past 3 Months, , Past 6 Months
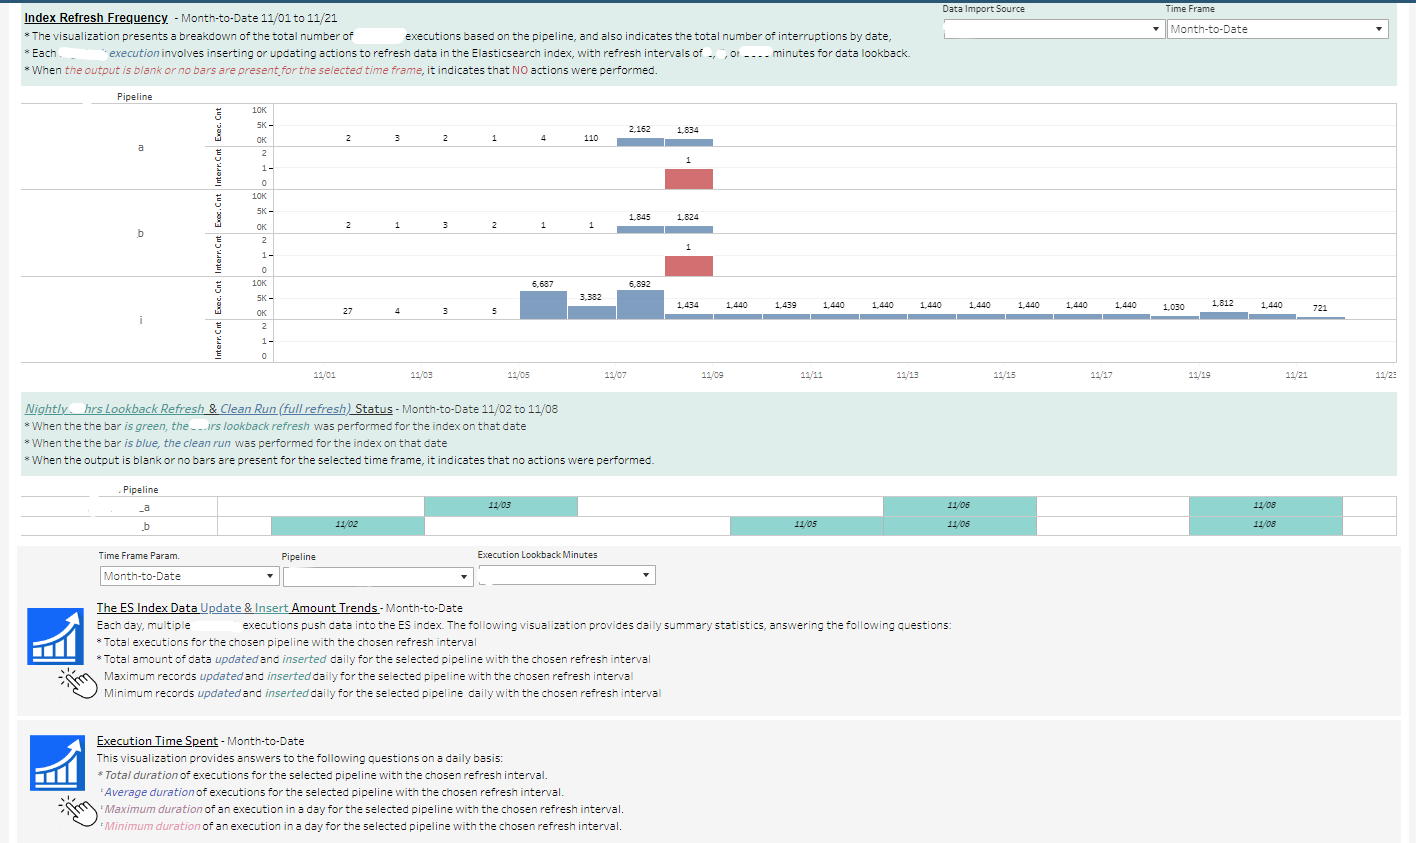
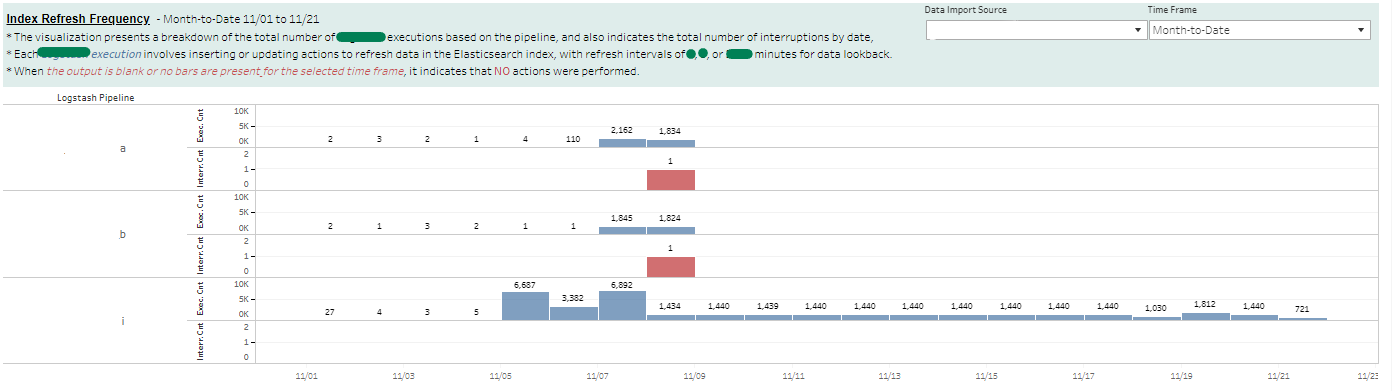
- Vis1: Refresh frequency & manual interpretation trend
- The visualization presents a breakdown of the total number of executions (blue bars) based on the pipeline and also indicates the total number of manual interruptions (red bars) by date.
- When the output is blank or no bars are present for the selected time frame, it indicates that NO actions were performed.
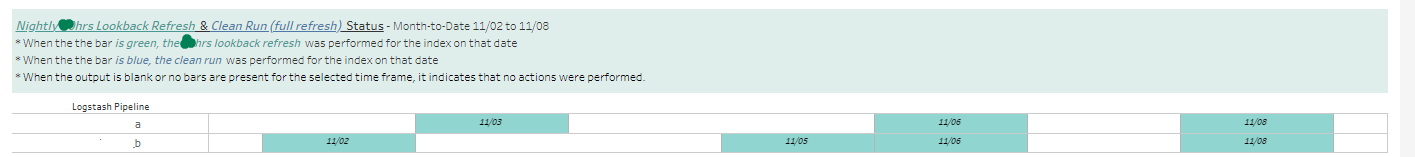
- Vis2: Nightly xx hrs Lookback Refresh & Clean Run (full refresh) Status
- Nightly refresh on a daily basis, if the green color shaded presents, the pipeline was executed.
- Clean Run: this is a xx refresh of data into a new index and the process was created to prevent losing data. If the blue color shaded presents, the pipeline was executed.
2nd Section
- 3 Parameters
- time frame: Previous Day, Week-to-date, Month-to-date, Quarter-to-date, Past 3 Months, , Past 6 Months
- Pipeline
- Execution Lookback Minutes: x min, x min, >=x min
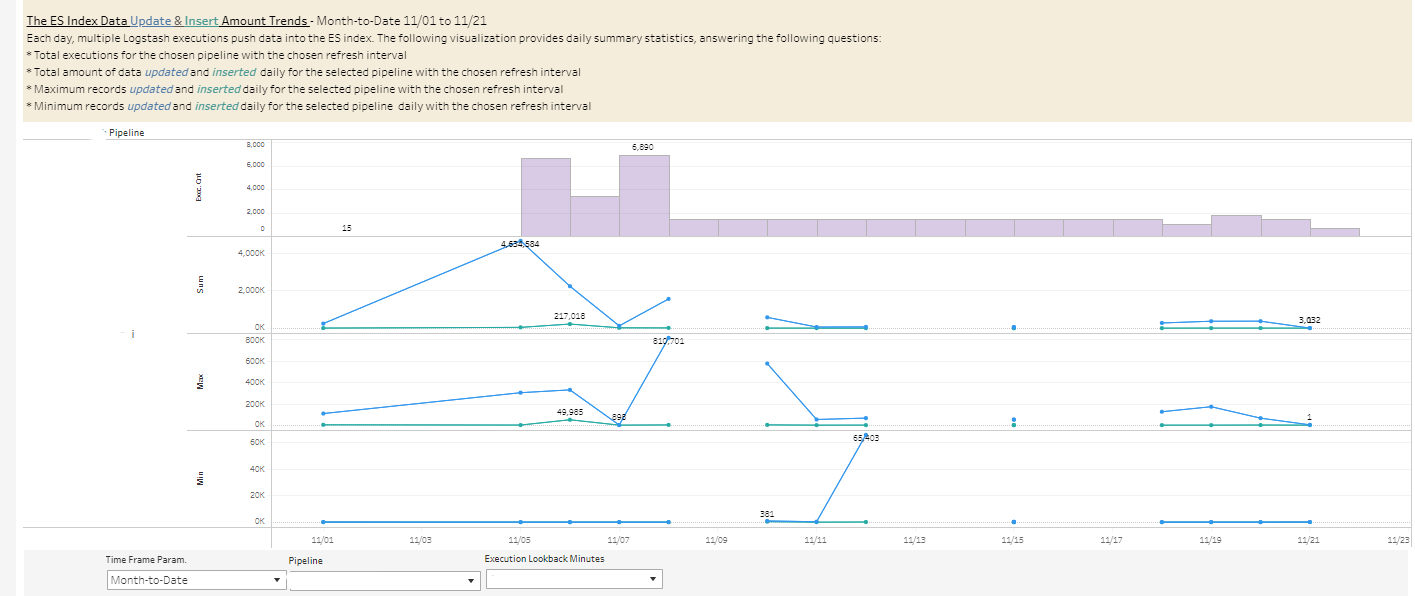
- Click to view Vis1: The ES Index Data Update & Insert Amount Trends
- The visualization provides daily summary statistics, answering the following questions:
- Total executions for the chosen pipeline with the chosen refresh interval
- Total amount of data updated and inserted daily for the selected pipeline with the chosen refresh interval
- The maximum amount of records updated and inserted daily for the selected pipeline with the chosen refresh interval
- The minimum amount of records updated and inserted daily for the selected pipeline with the chosen refresh interval
- The visualization provides daily summary statistics, answering the following questions:
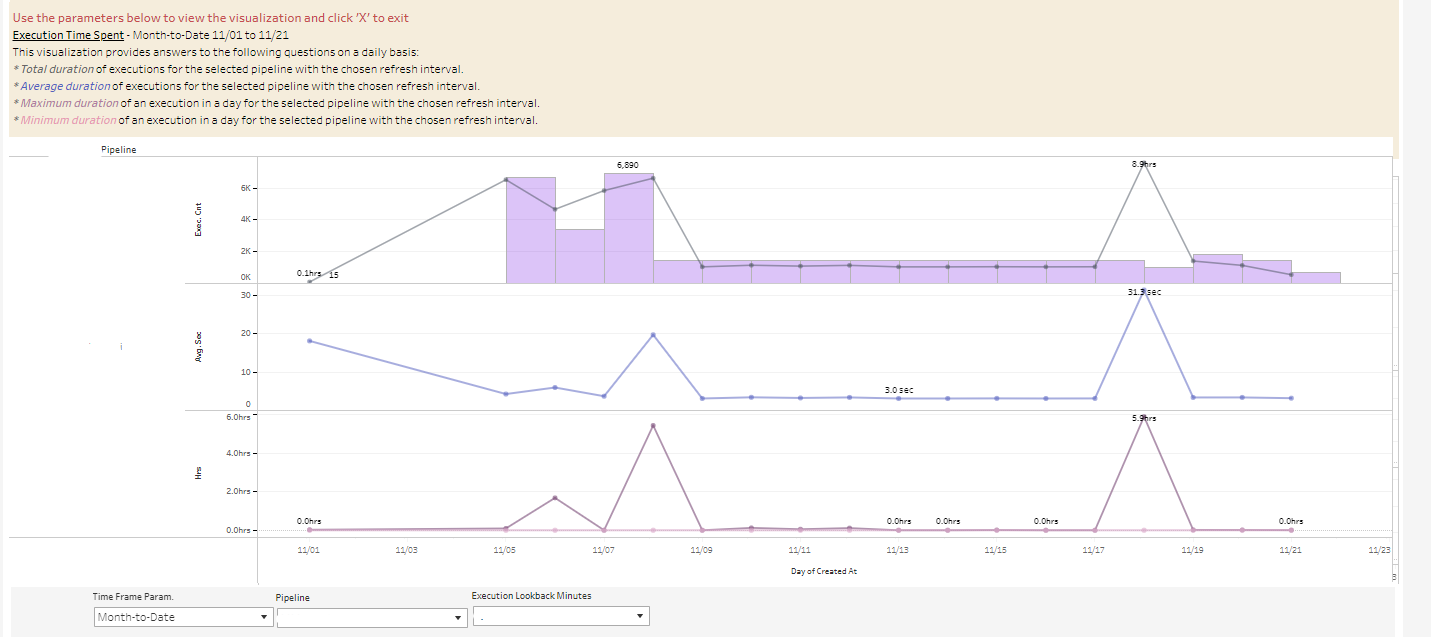
- Click to view Vis2: The Execution Time Spent
- This visualization provides answers to the following questions on a daily basis:
- Total duration of executions for the selected pipeline with the chosen refresh interval.
- Average duration of executions for the selected pipeline with the chosen refresh interval.
- Maximum duration of execution in a day for the selected pipeline with the chosen refresh interval.
- Minimum duration of execution in a day for the selected pipeline with the chosen refresh interval.
- This visualization provides answers to the following questions on a daily basis: