Before you start
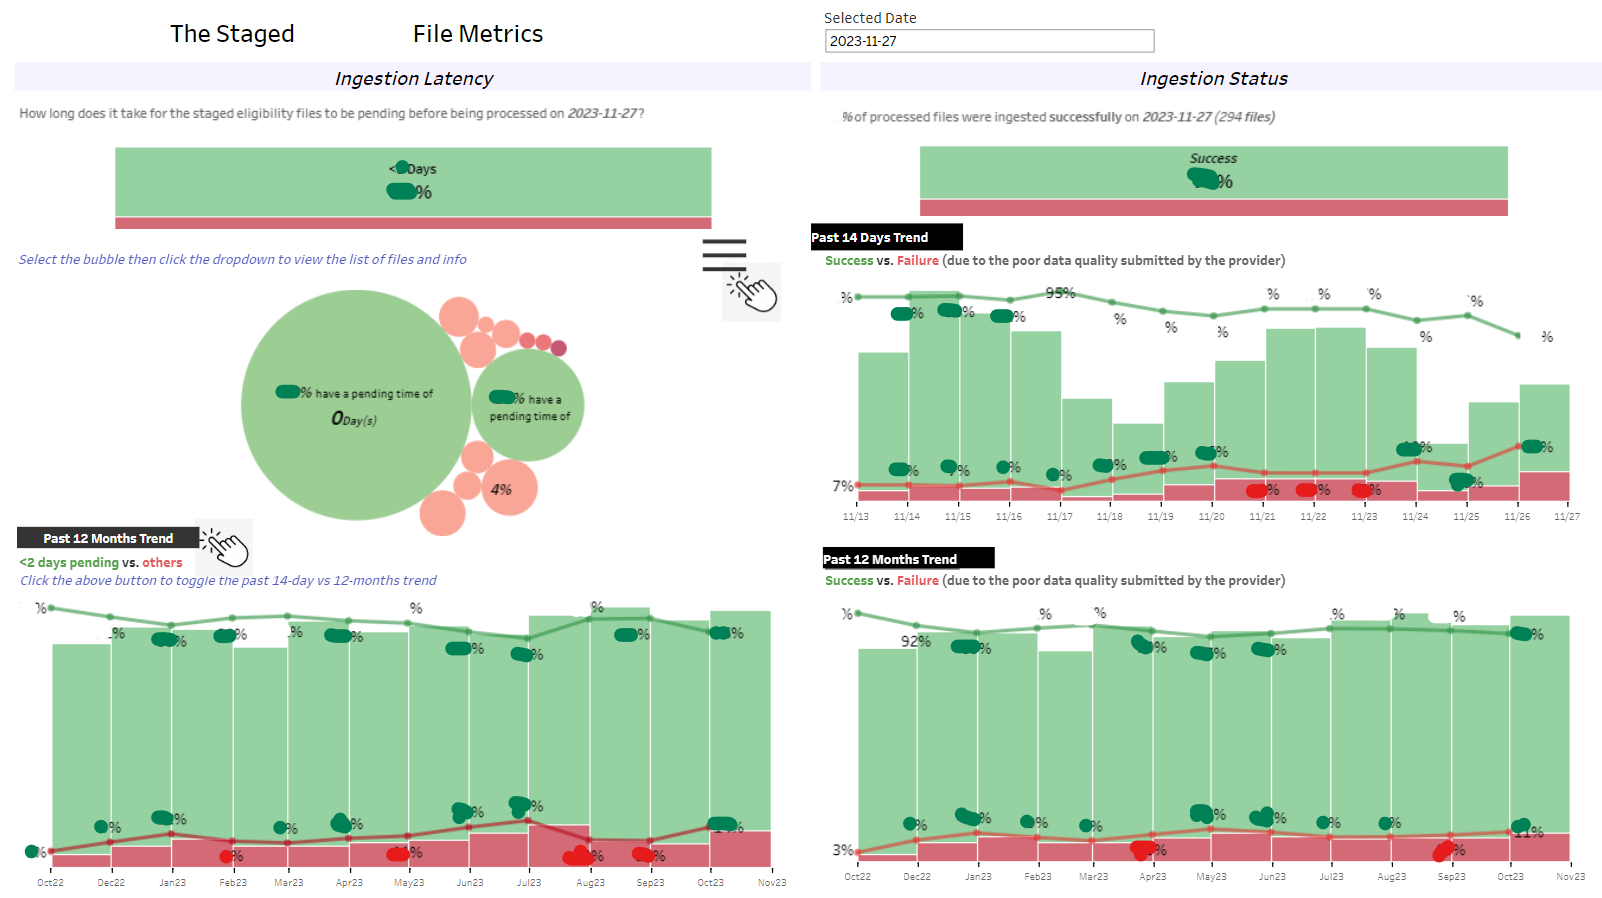
- The dashboard contains the daily summary, past 14 days & past 12 months' trends for latency and ingestion status metric
- The metrics and visualizations displayed on the dashboard change based on the selected date in the upper right corner
- Latency: the estimated time it takes for a file to be pending state before being processed on the selected date.
- Goal: <x Days pending time
- Others: >= x Days pending time
- Ingestion Status: If the ingestion status of a file is successful, the data in the file syncs downstream
- Success: the data quality errors presented in a file < x%
- Failure: the data quality errors presented in a file >= x%
Latency Summary
- Daily Latency Summary
- bar chart - For files processed on the chosen date, this section provides a simple overview of how long files stayed in a pending state, divided into two groups: those processed <x Days and those that took longer (Others)
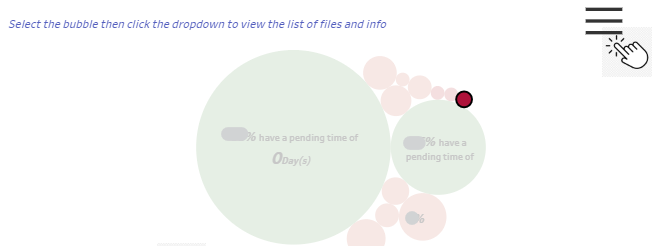
- bubble chart - This chart categorizes files processed on the selected date by the number of days they were pending. Each bubble represents a pending date, and its size indicates the volume of files assigned to that group
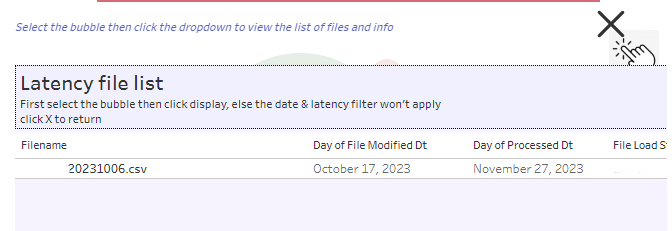
- drop-down - You can select a bubble, and click the drop-down to view the detailed list of files.
- Past 14 Days Trend
- This section provides a past 14 days trend, each bar represents the percentage of total files processed on the date, grouped into two categories: files processed in <x Days and those taking longer (Others).
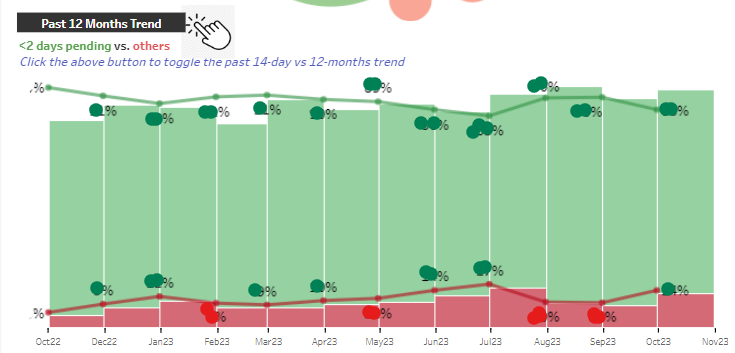
- Past 12 Months Trend
- This section provides a past 12 months' trend, each bar represents the percentage of total files processed in the month, grouped into two categories: files processed in <x Days and those taking longer (Others).
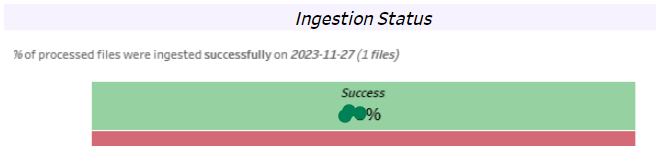
Ingestion Status Summary
- Daily Latency Summary
- bar chart -This section offers an overview of the number of files processed on the selected date, categorizing them into two groups: those with a successful ingestion status and those with a failed ingestion status.
- Past 14 Days Trend
- This section provides a past 14 days trend, each bar represents the percentage of total files processed on the date, grouped into two categories: those with a successful ingestion status and those with a failed ingestion status.
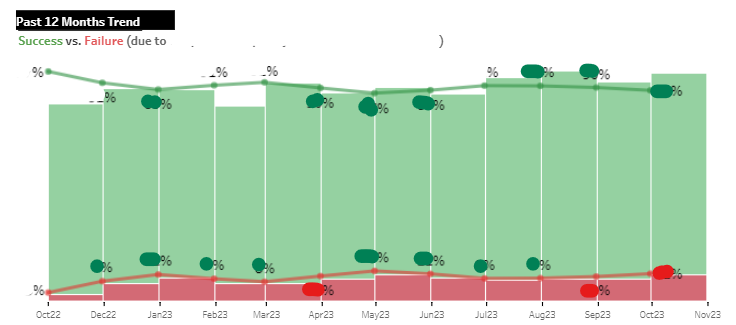
- Past 12 Months Trend
- This section provides a past 12 months trend, each bar represents the percentage of total files processed in the month, grouped into two categories: those with a successful ingestion status and those with a failed ingestion status.